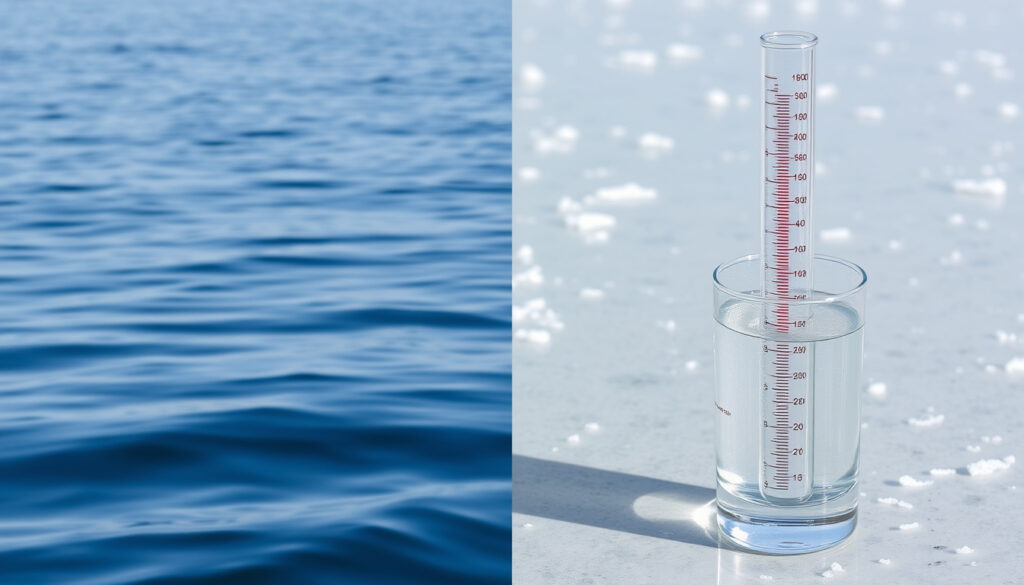
Sea Salinity: Average, Highest, and How It’s Measured
Imagine scooping up a glass of seawater — you already know it’s salty, but have you ever wondered exactly how salty? The salt in the ocean is more than just a taste; it’s a force that drives global currents and shapes marine ecosystems. This guide cuts through the numbers, from the average sea salinity of 35 ppt to the Dead Sea’s extreme 340 ppt, and breaks down how scientists measure this critical ocean property.
Average ocean salinity: 35 ppt (3.5%) ·
Highest natural lake salinity: Dead Sea ~34% (340 ppt) ·
Typical measurement unit: parts per thousand (ppt)
Quick snapshot
- Total dissolved salts in water, typically measured in ppt or percentage. (NASA Salinity oceanographic research agency)
- Average seawater: 35 ppt (3.5%). (NASA Salinity oceanographic research agency)
- Main ions: sodium and chloride. (NASA Salinity oceanographic research agency)
- Evaporation increases salinity; precipitation and river inflow decrease it. (NASA Salinity oceanographic research agency)
- Polar regions: lower salinity due to melting ice. (NASA Salinity oceanographic research agency)
- Subtropical zones: higher salinity due to high evaporation. (NASA Salinity oceanographic research agency)
- Dead Sea: ~34% (340 ppt).
- Red Sea: ~40 ppt.
- Brine pools: up to 400 ppt.
- Conductivity, temperature, depth (CTD) sensors. (RBR Global oceanographic instrument manufacturer)
- Units: ppt, g/L, ppm, percentage. (RBR Global oceanographic instrument manufacturer)
- Practical Salinity Scale (PSS-78). (NASA Salinity oceanographic research agency)
| Attribute | Value |
|---|---|
| Average Seawater Salinity | 35 ppt (3.5%) (NASA Salinity oceanographic research agency) |
| Dead Sea Salinity | ~340 ppt (34%) |
| Red Sea Salinity | ~40 ppt |
| Atlantic Ocean Salinity | 35–37 ppt (NASA Salinity oceanographic research agency) |
| Baltic Sea Salinity | ~7 ppt (lowest) |
| Common Measurement Unit | parts per thousand (ppt) (HORIBA water quality instrumentation specialist) |
What Is the Salinity of Seawater?
What does salinity mean?
- It is the total amount of dissolved salts — primarily sodium and chloride, but also sulfate, magnesium, calcium, and potassium — in a given volume of water. (NASA Salinity oceanographic research agency)
- The key idea: salinity is a measure of everything dissolved, not just table salt.
What is the average salinity of oceans?
- Average sea surface salinity is about 35 PSS (Practical Salinity Scale), with global values ranging roughly from 32 to 37 PSS. (NASA Salinity oceanographic research agency)
- In practical terms, that’s about 35 grams of dissolved salts per liter of seawater.
Six key oceans and their average salinity ranges make the pattern clear — the Atlantic is the saltiest, the Baltic the freshest.
| Ocean/Sea | Average Salinity (ppt) |
|---|---|
| Atlantic Ocean | 35–37 (NASA Salinity oceanographic research agency) |
| Pacific Ocean | 33–35 |
| Indian Ocean | 34–36 |
| Southern Ocean | 34–35 |
| Arctic Ocean | 28–32 |
| Baltic Sea | ~7 |
The pattern: the Atlantic’s higher range signals a more evaporation-driven basin with distinct ecosystem effects, while the Baltic’s low salinity reflects its restricted connection and large river inflow.
Why Is Seawater Salty?
Where do the salts come from?
- Rock weathering and river runoff carry dissolved minerals — sodium, calcium, magnesium — into the ocean.
- Hydrothermal vents on the ocean floor add dissolved minerals from the Earth’s crust.
- Volcanic activity and atmospheric deposition also contribute minor amounts.
How does the water cycle affect salinity?
- Evaporation removes water, concentrating salts — this is why subtropical high-pressure zones have higher salinity. (NASA Salinity oceanographic research agency)
- Precipitation and river inflow dilute salinity — polar regions and the Baltic Sea see the freshest conditions.
- These two opposite forces create a global salinity map with clear latitudinal bands.
Freshwater input from melting glaciers and increased rainfall in a warming world could shift these bands. The long-term effect on global salinity patterns remains an area of active research, challenging climate modelers to refine their projections.
The implication: salinity is not static — it’s a direct readout of where evaporation outpaces precipitation and vice versa. That balance shapes ocean circulation, which in turn shapes climate.
How Is Salinity Measured?
What units are used for salinity?
- Parts per thousand (ppt) — the most common unit for open-ocean and general use. (HORIBA water quality instrumentation specialist)
- Percentage (%) — 35 ppt = 3.5%. Used in hypersaline contexts like the Dead Sea.
- Practical Salinity Unit (PSU) — dimensionless, but numerically equal to ppt in oceanographic practice. (NASA Salinity oceanographic research agency)
- Grams per liter (g/L) — directly equivalent to ppt.
- Parts per million (ppm) — rarely used for seawater (35,000 ppm is 35 ppt).
What does 40% salinity mean?
- 40% salinity equals 400 ppt — a value found only in extreme environments like deep-ocean brine pools (NASA Salinity oceanographic research agency).
- For comparison, that’s more than 10 times saltier than typical seawater.
- No open-ocean body reaches this level; it’s confined to isolated basins with intense evaporation and minimal outflow.
Three measurement methods, one trade-off: modern conductivity sensors beat old titration for speed, but require calibration. Here is how the main techniques compare.
| Method | How It Works | Accuracy | Best For |
|---|---|---|---|
| Conductivity (CTD) | Measures electrical conductivity; converts via temperature/pressure correction (RBR Global oceanographic instrument manufacturer) | ±0.001 PSU | Open ocean, research vessels |
| Hydrometer | Measures density via buoyancy; air bubbles cause errors (Atlas Scientific water testing equipment provider) | ±0.5 ppt | Aquariums, field estimation |
| Satellite (microwave) | Passive radiometry from SMAP/SMOS — valid only in open ocean (NOAA CoastWatch federal ocean monitoring program) | ±0.2 PSU | Global mapping, climate studies |
The implication: each method serves a different purpose — CTD for precision, satellite for scale, hydrometer for accessibility — and oceanographers must weigh accuracy against coverage.
The Practical Salinity Scale (PSS-78) is the universal standard, but its unit-less nature can confuse newcomers — a reading of 35 on a PSS meter is the same as 35 ppt. For the average reader, thinking in ppt or percentage avoids the ambiguity.
Which Sea Has the Highest Salinity in the World?
Which ocean has the highest salinity?
- The Atlantic Ocean is the saltiest of the five major ocean basins, averaging 35–37 ppt. (NASA Salinity oceanographic research agency)
- High evaporation in the subtropics and relatively narrow connections to fresher polar waters drive this.
Which is saltier, the Red Sea or the Dead Sea?
- The Dead Sea is far saltier — its salinity is around 340 ppt (34%), compared to the Red Sea’s ~40 ppt (4%).
- The Dead Sea is a landlocked lake with no outflow; continuous evaporation has concentrated salts to extreme levels.
What is 10 times saltier than seawater?
- Deep-ocean brine pools — found in the Gulf of Mexico and the Mediterranean — reach 400 ppt (40%), roughly 11 times the open-ocean average.
- These pools form when ancient salt deposits dissolve and the dense brine settles in seafloor depressions.
The biggest contrast in the world’s saltiest bodies: the Dead Sea’s 340 ppt versus the Atlantic’s 37 ppt shows what happens when a lake has no outlet versus an open-ocean system.
| Water Body | Salinity (ppt) | Type | Key Driver |
|---|---|---|---|
| Dead Sea | ~340 | Landlocked lake | Extreme evaporation, no outflow |
| Brine pools (Gulf of Mexico) | ~400 | Seafloor basin | Dissolved ancient salt deposits |
| Red Sea | ~40 | Marginal sea | High evaporation, limited exchange |
| Atlantic Ocean | 35–37 | Open ocean | Evaporation > precipitation in subtropics |
| Baltic Sea | ~7 | Marginal sea | Large river inflow, restricted connection |
The pattern: hydrology determines the ceiling — open-ocean salinity tops out near 37 ppt, while closed basins can concentrate salts by a factor of 10 or more.
Are Salt and Salinity the Same?
What is the difference between salt and salinity?
- Salt (NaCl) is a single compound — sodium chloride — that makes up about 85% of the dissolved solids in seawater.
- Salinity is the total concentration of all dissolved salts, including sulfate, magnesium, calcium, and potassium. (NASA Salinity oceanographic research agency)
- They are not interchangeable. A salinity reading of 35 ppt does not mean 35 grams of table salt per liter; it means 35 grams of all dissolved ions.
Most people think of “salt” when they taste seawater, but salinity science is about the aggregate ionic load — a nuance that matters when studying ocean chemistry or calibrating instruments, but rarely changes the everyday experience of a salty swim.
The implication: using “salt” and “salinity” interchangeably confuses measurement. A pool manager testing salt levels for a chlorine generator is measuring one ion; an oceanographer measuring salinity for the Argo array is measuring eight major ions — and the scale differs.
What’s Confirmed and What’s Unclear
Confirmed facts
- Ocean salinity averages 35 ppt. (NASA Salinity oceanographic research agency)
- Dead Sea salinity exceeds 300 ppt.
- Evaporation increases salinity, freshwater inflow decreases it. (NASA Salinity oceanographic research agency)
- Conductivity-based salinity measurement is the global standard. (RBR Global oceanographic instrument manufacturer)
- Satellite salinity data is only valid for open ocean. (NOAA CoastWatch federal ocean monitoring program)
What’s unclear
- Precise salinity of ancient seas is inferred from geological proxies.
- Long-term effects of climate change on global salinity patterns are still being studied. (NASA Salinity oceanographic research agency)
- Impact of brine pool dynamics on deep-ocean ecology remains under-researched.
“Salt dissolved in seawater — measured as salinity — drives currents that distribute heat and carbon around the globe.”
— NASA Salinity Mission
“In sea water, there is typically close to 35 grams of dissolved salts in each liter (35 ppt), but ranges between 33-37 grams per liter.”
— NOAA
For oceanographers and climate modelers, the choice is clear: invest in quality CTD instruments and cross-reference with satellite data, or risk relying on sparse measurements that miss the spatial variability shown by SMAP’s daily gridded salinity fields (at 0.25-degree resolution, available near-real-time from NOAA CoastWatch federal ocean monitoring program).
accession.nodc.noaa.gov, rmets.onlinelibrary.wiley.com, sciencedirect.com, salinity.oceansciences.org, svs.gsfc.nasa.gov
For a deeper look at how salt concentrations are categorized and measured worldwide, see this overview of definition and average of sea salinity.
Frequently asked questions
What is the difference between salinity and salt?
Salt (NaCl) is one compound among many dissolved in seawater. Salinity is the total concentration of all dissolved salts, including ions like sulfate, magnesium, calcium, and potassium.
How is salinity measured in different oceans?
Salinity is measured using conductivity, temperature, and depth (CTD) sensors on ships, and by satellite microwave radiometry (SMAP/SMOS) for open-ocean surface measurements. The World Ocean Atlas provides quality-controlled mean data (NOAA NCEI federal ocean data archive).
What is the average salinity of the Atlantic Ocean?
The Atlantic Ocean averages 35–37 ppt, making it the saltiest of the major ocean basins.
What is the importance of measuring salinity?
Salinity drives ocean currents that distribute heat and carbon globally, influences marine life habitats, and is a key variable in climate modeling.
Can salinity change over time?
Yes — evaporation and precipitation create seasonal and regional variations. Long-term changes may occur due to melting glaciers and shifting rainfall patterns associated with climate change.
What is the salinity of the Mediterranean Sea?
The Mediterranean averages about 38 ppt, slightly higher than the open Atlantic due to high evaporation and limited exchange with the Atlantic.
How does salinity affect marine life?
Different species have adapted to specific salinity ranges. Sudden salinity changes can stress organisms; extreme salinities like the Dead Sea (340 ppt) support only specialized microbes.
Related reading: Poison Ivy: Global Distribution, Rash, and Differences from Irish Ivy · Middle Ages: Definition, Timeline, and Key Events
More related posts
 Louis Russell: Custody Battle, Baby Mother & Career
 Phoebe Tonkin: Marriage, Split, and Latest News
 Jim Henson Cause of Death, Personal Life & Legacy
 Dakota Joshua: Cancer Diagnosis, Trade to Maple Leafs
 Fort St John Tickets – 2025 Events, Venues and Prices
 When is Super Bowl 2026? Date, Time, Performers & Tickets
 Kathy Griffin’s Comeback: Cancer, Facelifts, Divorce
 Angela White: Biography, Career, and Answers to Common Questions
